Monitorização Criosfera - 2008

Paulo H

Cumulonimbus
Registo
2 Jan 2008
Mensagens
3,271
Local
Castelo Branco 386m(489/366m)
Re: Seguimento Criosfera 2007/2008

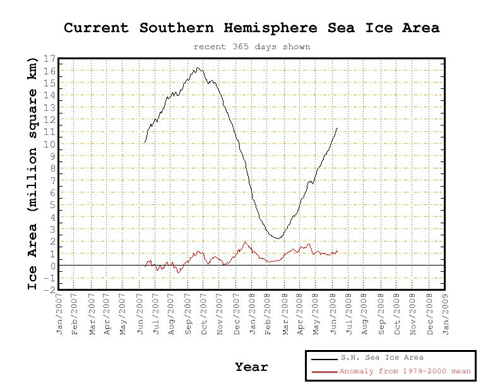
Oceano Antárctico está a arrefecer
Expedição científica a bordo do navio Polarstern terminou na semana passada

"Polarstern em viagem num ambiente fantástico
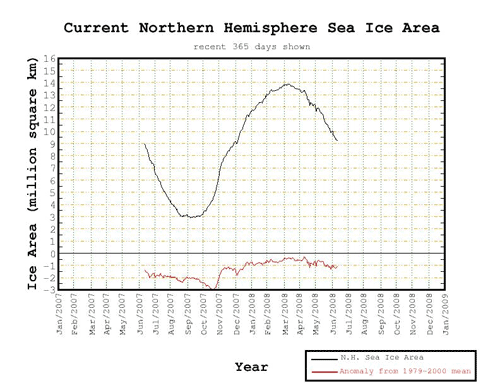
O mar profundo da Antárctida está a arrefecer, o que pode estar a estimular a circulação das massas de água oceânicas. Esta é a primeira conclusão da expedição a bordo do "Polarstern", uma iniciativa do Instituto alemão Alfred Wegener para a Investigação Polar e Marinha que terminou na semana passada em Punta Arenas, no Chile. Segundo os investigadores, as imagens de satélite recolhidas durante o Verão antárctico revelam a maior extensão de gelo marinho alguma vez registada. "

Fonte: CiênciaHoje

Fiquei algo confuso, pois não consegui perceber se se trata do "mar profundo" arrefecendo ou do arrefecimento nas profundezas do mar!

Se houvesse aquecimento na Antartida seria natural o descongelamento de antigas calotes polares, com o consequente fluxo de água doce a 0ºC para as profundezas (como que uma corrente marítima) provocando tal arrefecimento!

Também desconhecemos a velocidade de resposta do sistema, ou melhor, o desfasamento temporal entre as causas e os respectivos efeitos. Quanto tempo levaria uma calote antartica do tamanho do Algarve descongelada a infiltrar-se no oceano até às profundezas?! A água doce a uma temperatura baixa demora algum tempo a misturar-se com a água salgada, até pode ramificar-se em várias correntes e dissipar-se numa vasta região arrefecendo-a. É por isso que se deve ter sempre alguma reserva ao associar dados/constatações que não passam de efeitos/consequências de com fenómenos actuais, pois provavelmente terão mais a ver com fenómenos ocorridos no passado recente!

Tenho sempre algumas reservas, penso que existe muita coisa ainda por explorar.


LUPER

Nimbostratus
Registo
20 Nov 2005
Mensagens
1,945
Local
Aveiro
Re: Seguimento Criosfera 2007/2008

Fiquei algo confuso, pois não consegui perceber se se trata do "mar profundo" arrefecendo ou do arrefecimento nas profundezas do mar!

Se houvesse aquecimento na Antartida seria natural o descongelamento de antigas calotes polares, com o consequente fluxo de água doce a 0ºC para as profundezas (como que uma corrente marítima) provocando tal arrefecimento!

Também desconhecemos a velocidade de resposta do sistema, ou melhor, o desfasamento temporal entre as causas e os respectivos efeitos. Quanto tempo levaria uma calote antartica do tamanho do Algarve descongelada a infiltrar-se no oceano até às profundezas?! A água doce a uma temperatura baixa demora algum tempo a misturar-se com a água salgada, até pode ramificar-se em várias correntes e dissipar-se numa vasta região arrefecendo-a. É por isso que se deve ter sempre alguma reserva ao associar dados/constatações que não passam de efeitos/consequências de com fenómenos actuais, pois provavelmente terão mais a ver com fenómenos ocorridos no passado recente!

Tenho sempre algumas reservas, penso que existe muita coisa ainda por explorar.

Outra possivel explicação, digo eu, será a diminuição de sunspots ao longo do ciclo 23. É muito dificil saber o que se passa, por muitos estudos que existam, o numero de variáveis é tão grande e complexo, que ainda levará muitos anos a que o Homem consiga ter uma resposta cabal sobre o que se passa.
 

Vince

Furacão
Registo
23 Jan 2007
Mensagens
10,624
Local
Braga
Re: Seguimento Criosfera 2007/2008

Deixo uma série de textos interessantes sobre gelo, neve, água e aquecimento global. Acho que vale a pena a leitura dos mesmos. Mais neve e gelo não é contraditório com aquecimento. Se há mais vapor de água na atmosfera pode haver mais neve. Pelo que a questão fundamental não é tanto a existência pontual de bastante neve ou gelo em determinado local e altura do ano, mas quanto tempo ele se aguenta, pois se aguentar bastante há menos aquecimento devido ao albedo, de contrário mais neve até poderá ser um sintoma de aquecimento devido à presença de mais vapor de água em locais ou alturas do ano que são frias mas secas, como por exemplo Bagdad/Iraque este ano , ou quem sabe, especulando, as cotas baixas em Portugal de 2006 e 2007. Nós cá em Portugal bem que conhecemos o terrivel duelo entre o frio e a precipitação.

Este ano será por isso bastante importante seguir o que se passará no Ártico em Agosto e Setembro.

If global warming is occurring, why was the winter of 2007-2008 so cold and snowy?

The planet was much snowier and warmer than usual during the winter of 2007-2008, according to statistics released today by the National Climatic Data Center. Snow cover extent over the Northern Hemisphere during the period December 2007 - February 2008 was the fourth greatest on record, and was the greatest on record for January. Satellite-derived snow cover records extend back to 1967. Some regions of the Middle East, such as Baghdad, Iraq saw their first snow in living memory, and seasonal snowfall records were broken in Wisconsin and a few places in the Northeastern U.S. Surprisingly, the winter also ranked much above average in temperature--it was the 16th warmest December through February period in the 128-year global record. This puts the winter of 2007-2008 in the warmest 13% of all winters. Temperatures this winter were a bit cooler than recent winters because of an ongoing strong La Niña event in the Eastern Pacific Ocean, which has dramatically cooled the ocean surface waters. By one measure (the surface pressure difference between Darwin and Tahiti), February 2008 was the strongest February La Niña event on record. The last time we had a winter this cool was during 2000-2001, which also happened to be the last time we had a major winter La Niña event.

Figure 1. Departure of temperature from average for the winter of 2007-2008. Image credit: National Climatic Data Center.

A normal winter for the U.S.
December 2007 through February 2008 was about average in the contiguous U.S.--the 54th coolest winter on record in the 113 year period of record. The average temperature was 33.2°F (0.6°C), which was 0.2°F (0.1°C) above the 20th Century mean. It was the 18th wettest December-February in the 1895-2008 record. New York experienced its wettest winter on record, and the states of Colorado, Connecticut, Pennsylvania, and Vermont experienced their second-wettest winter on record. Only the South received below normal levels of precipitation, mostly due to a dry winter in Texas.

All time winter snowfall records have already been set in some portions of the Northeast U.S. and Wisconsin. As of March 12, Madison, WI had accumulated 92 inches of snow, smashing the previous seasonal snowfall record of 76.1 inches (193.3 cm) of snow in the winter of 1978-1979. Two locations in the Northeast have set new winter snowfall records, and more records will fall if an average amount of snow falls in March. By the end of February, new snowfall records for the season-to-date were also set in both Telluride and Aspen, Colorado.

An exceptionally warm winter in Northern Europe and Asia, cold in Central Asia
Northern Asia and northern Europe experienced an exceptionally warm winter, with Sweden and Finland recording their warmest winters ever, and Norway, its second warmest. Conversely, Tajikistan recorded its coldest winter in 30 years, and heavy snows in Kazakhstan caused severe flooding when they melted. Snow storms and cold weather in China this winter killed 129 people and did over $21 billion in damage.

Why did we see a cool winter, if global warming is occurring?
It is important to understand the difference between weather and climate. Climate is what you expect; weather is what you get. What we experience in one particular season or year is "weather". Weather has a large variation from year to year, with cool seasons and years mixed in with warms ones. "Climate" is the weather measured on scales of tens of years or longer. One cool winter or year is not an indication that the climate is cooling back to normal. The climate is warming, and unless we see a series of several years of cool conditions, this year's cool winter merely represents a normal fluctuation of the weather. Relatively cool weather is to be expected globally during a strong La Niña event in the Eastern Pacific Ocean, and relatively warm weather is expected during an El Niño event. We shouldn't expect to see record warmth for the globe unless an El Niño event is occurring.

Why did we see record snows this winter, if global warming is occurring?
Beware of global warming skeptics trumpeting record snowfalls this winter as an excuse to doubt that global warming is occurring. One should primarily look at global temperatures on a scale of decades to judge the validity of global warming. Dr. Ricky Rood, who writes our Climate Change blog, put it this way in his current blog, Creeping Onset of Spring and in an earlier blog, Water, water, water:


This year has been very snowy in the northern hemisphere. That it is snowy does not suggest that it is colder. If it gets warmer, it does not mean that we no longer see freezing temperatures in places like Michigan. If it gets warmer there is more water in the atmosphere, and when there is precipitation there will be more precipitation, and if it is below freezing, then that precipitation will be ice and snow. The high mountains near the coast, like the Cascades and the Sierra Nevada would expect more snow. This is also true for the high altitudes parts of Greenland and Antarctica. From a climate point of view it is more important to look at snow cover in the late winter and early spring. Is the snow melting earlier?

n03plotog1.png


Arctic sea ice recovers a bit
It will be interesting to see if this year's heavy Northern Hemisphere snow cover melts earlier than usual, as this will have a big impact on the annual Arctic sea ice melt. We're starting off with more ice surface area in the Arctic than in the past four years--February 2008 Northern Hemisphere sea ice extent was greater than each of the previous four years, thanks to cooler than usual temperatures over much of the Canadian Arctic. However, this was still the fifth lowest ice extent on record for the month of February, and 8% below its extent in 1979 when satellite measurements began, according to the National Snow and Ice Data Center. February was the third straight month that a new monthly minimum Arctic sea ice record was not set, following a string of five months in a row where monthly records were set. The extra sea ice extent will help to reduce the amount of melting this summer, but this effect will probably be overshadowed by the fact that natural wind patterns have forced a large amount of thick, multi-year ice out of the Arctic this winter. This has left much of the sea ice very thin, making it very vulnerable to melting. For the first time on record, the edge of thin first-year ice has pushed beyond the North Pole. IF we get another relatively warm and sunny summer in the Arctic in 2008, we will likely see Arctic sea ice loss surpassing last year's astounding collapse.

http://www.wunderground.com/blog/JeffMasters/comment.html?entrynum=916&tstamp=200803
 

Vince

Furacão
Registo
23 Jan 2007
Mensagens
10,624
Local
Braga
Re: Seguimento Criosfera 2007/2008

Water, Water, Water

The observed and predicted changes to the climate that are forced by carbon dioxide and other greenhouse gases is often called “global warming.” Few argue that the Earth has warmed in the past century. There is a large body of evidence that this observed warming is related to increasing greenhouse gases. Greenhouse gases increase because of the burning of fossil fuels. This warming can be distinguished from warming that occurs due to known sources of natural variability. If there is warming due to unknown sources of variability, well – we really can’t say anything about that which we know nothing about. We continue to look for that which we do not know, but the likelihood of us finding a mechanism other than greenhouse gas increases to explain the current warming is very low. The physics of the warming are simple and robust, and the information collected from many sources is consistent to a very high degree. There is some information that is inconsistent or still not satisfactorily explained. I cannot point to any inconsistency that I am aware of that would be a potential smoking gun to refute the basic tenets of “global warming.”

Warming is the most simple and the most sure prediction. An increase in sea level rise due to both the warming of the oceans and melting of ice on land is also quite certain. The change in sea level is an indicator of the role of water in the climate. In a consequential way, climate change is more about water than it is about warming. The difference between ice ages and temperate periods is a difference between water being stored as ice, liquid, or vapor. The temperature of the atmosphere strongly influences the amount of water vapor that can be held in the atmosphere as well as the amount of ice that exists on land. It is the balance between the different phases of water that defines climate regimes like the ice age, temperate periods, and a greenhouse.

People, economies, and ecosystems have evolved or adapted to the balance of water. From a basic biological point of view, people have shown the ability to survive in virtually all types of watery environments. The ability to thrive is perhaps most closely related to the ability to produce the energy of food crops, and this ability is strongly linked to having water available in the liquid phase. In today’s world there are enormous amounts of water used in the production of energy. It’s used to cool and clean and heat for stream. In the productions of bio-fuels such as ethanol, water is used at many stages in the process. Water, therefore, is at the center of it all. It is central to the stability of the physical climate, ecosystems, agriculture, energy production, and, of course, we need water to drink.

An important point is that water is a stressed resource. Water is a stressed resource, and climate change is an additional stress on this resource. Climate change is not the cause of the stresses on water. In most cases climate change will amplify the stress on water resources. There might be some places where climate change improves the availability of liquid water. Even in this case, however, changes in the expected distribution in water will challenge the large engineering projects that we use to manage water. Water is one of the places where climate change, engineering, policy, and litigation intersect most strongly.

The balance of water between vapor, liquid, and gas is not only of central interest to the global climate, but the phase transitions of water also play a central role in weather. When water changes from vapor to liquid or from liquid to ice, energy is released. When ice melts and liquid evaporates energy is absorbed. This energy is in the form of heat. In clouds there is ice, liquid, and vapor, and conversion of vapor to liquid and ice is important not only for the production of precipitation, but for the release of heat. The release of heat then makes the air more buoyant and the clouds rise higher.

The energy released by water is important to developing weather systems. As many WU users know, there are some significant differences between weather systems in the tropics and weather systems in middle and high latitudes. While the release of energy by the condensation of water vapor is important in most weather systems, this mode of energy conversion is more important in the tropics than outside of the tropics.

Water is also a greenhouse gas. In fact, in the Earth’s radiative balance, water is by far the most important greenhouse gas. Its influence on the radiative budget is larger than the influence of carbon dioxide. Carbon dioxide works on the margins; those who own a business know how things are won and lost on the margins. One way to think of carbon dioxide is like having a window cracked. The quirks of the heating system in my apartment make it very warm, and a small crack in the window makes the place habitable. The surface of the Earth cools directly to space in only a small crack in the sky. Carbon dioxide is closing that crack. (Who remembers Crack the Sky?)

The oceans of the world are huge supplies of water. As the atmosphere and the oceans warm, more water vapor is held in the atmosphere. The consequences of this are 1) there is more water to act as a greenhouse gas, which warms the surface some more (a positive feedback effect); 2) there is potentially more energy to be released in developing storms, and hence, the potential for stronger winds; 3) there is more water available for rain and snow, and hence, the potential for heavier rain and more floods; 4) the fundamental modes by which middle latitude storms get their energy might change with time. (Looking forward to the responses from this one! Plus, where do more droughts come from? Of course there is the huge complication of clouds that fascinate meteorologists, climatologists, and the committed blog readers of the world.)

Water, water, water: Just because the globe is warming does not mean that it ceases to snow. In fact, there are many situations and places where the snow might increase. That the planet is warmer does not mean that it no longer gets below freezing. The high mountains near the coast, like the Cascades and the Sierra Nevada would expect more snow. This is also true for the high altitudes parts of Greenland and Antarctica. It is reasonable to expect stronger snow storms in many parts of the eastern U.S. because 1) there is more water in the air, and 2) it still gets below freezing. Near the Great Lakes more snow is possible because the lakes don’t freeze over, and they can keep supplying moisture to the air.

The real challenge of water is how long it stays as ice and snow. If it is ice and snow and it melts slowly, then it is a good supply of water. If it melts rapidly, then it can be a flood and might be lost for summer irrigation. If there is snow on the ground it reflects solar radiation back to space. If there is snow on sea ice it keeps the ice from melting in the summer. For climate an important variable is how long the snow stays around.

RBRWuG0059_water_cycle_usgs_big.jpg


http://www.wunderground.com/blog/RickyRood/comment.html?entrynum=58&tstamp=200801
 

Vince

Furacão
Registo
23 Jan 2007
Mensagens
10,624
Local
Braga
Re: Seguimento Criosfera 2007/2008

Arctic sea ice melting season begins

The annual Arctic melting season has begun. We've just passed the Spring Equinox, so the North Pole is now in 24-hour daylight. Will the melting of Arctic sea ice this year surpass last year's record? Well, we have a greater areal extent of ice over the Arctic this month compared to April of last year, thanks to some cool Arctic temperatures this winter. In particular, the ice in the Bering Straight between Alaska and Russia extends quite a bit further south than in 2007. This extra ice will likely delay the melting season a bit this year, giving some hope that we won't surpass last year's record melt. However, if weather similar to last summer occurs--unusually clear skies and high pressure over the Arctic--this extra ice will not help much, because it is all thin, first-year ice. It is the thick, 2-9 year old ice that is most able to resist summer melting, and the amount of old multi-year ice is only about half of what it was in 2007. This is apparent from images taken by the QuikSCAT satellite, which carries the SeaWinds scatterometer. This instrument emits a pulse of microwave energy that bounces off the ice and returns to the satellite. Old, multi-year ice is thicker, and reflects a different amount of microwave energy back to the satellite than thin ice, resulting in a whiter image. Thin, first-year ice appears a darker grey. It is apparent from Figure 1 that we have only about half of the old, multi-year ice that we had last year. In fact, thin first-year ice extends past the North Pole, raising the distinct possibility that this year's melt will allow one to sail a ship all the way to the North Pole in September, for the first time since humans began testing Arctic waters with ships in 1497. In addition, a large region of the old ice north of Alaska is highly fractured, making it vulnerable to melting.

seaice2007-2008.png


Figure 1. QuikSCAT images of the Arctic from April 4, 2007 and April 4, 2008. The boundary of old, multi-year ice is marked in yellow, and 2008 has about half the old ice of 2007. Image credit: NOAA/NESDIS/ORA.

How did we lose so much old ice in the past year?
Part of the lost old ice melted during the record-breaking melt season of 2007, which was fueled both by global warming and a natural (but unusual) sunny summer. Another big chunk of old ice was lost due to natural wind patterns between September 2007 and March 2008. An animation of the sea ice available from Environment Canada's sea ice page (click on "Updated QuikScat animation") reveals that strong winds pushed large amounts of old ice out of the Arctic southward along the east coast of Greenland. So, we can't blame the melting of the Arctic sea ice entirely on global warming--natural weather patterns also played a significant role.

The forecast
It's impossible to guess what the dominant Arctic weather pattern will be this summer, and what level of melting we will get. With the loss of so much old ice over the past year, though, even an average summer has the potential to melt much more ice this summer compared to last summer--all the way to the North Pole. There's also a good chance that we'll see the fabled Northwest Passage open up again, since most of the ice along the Passage is young, first-year ice. We'll just have to wait and see how the summer unfolds.

http://www.wunderground.com/blog/JeffMasters/comment.html?entrynum=916&tstamp=200803
 

Vince

Furacão
Registo
23 Jan 2007
Mensagens
10,624
Local
Braga
Re: Seguimento Criosfera 2007/2008

Summer Snow
Total snow cover for the northern hemisphere (NH) is an important indicator of the condition of the climate, and a factor affecting northern-hemisphere albedo. More snow cover doesn’t necessarily indicate colder temperatures. Total snowfall depends on temperature and humidity, and warmer temperatures increase the amount of water vapor the air can hold, increasing the total potential snowfall. Still, they’re at least partly related to temperature; there’s certainly more snow during winter than summer. Snow is an important part of the earth’s albedo, or reflectivity to incoming sunlight; fresh snow is one of the most highly reflective surfaces found on the planet.

Has snow cover shown trends over the last several decades? NH snow cover data since late 1966 can be obtained from Rutgers University. Let’s take a look.

A plot of snow cover in the NH shows a distinct (and not unexpected) strong annual pattern, more in winter and less in summer:

snow.jpg


The annual pattern is easier to see if we zoom in on just a few years of data:


snow2.jpg


To look for trends, it’s useful to remove the annual cycle from the data in order to compute the difference between a given month’s snow cover and what’s typical for that month; this defines snow cover anomaly:

snowanom.jpg


There’s a clear, and statistically significant, trend over the last 40 years. Annual average NH snow cover has declined by about 41,000 km^2 per year.

But the trend has not in fact been linear. We can smooth the snow cover data with a Savitsky-Golay filter, which not only enables us to compute the estimated smoothed value, but a likely error range as well:

snowsmooth.jpg


Apparently NH snow cover declined sharply during the 1980s, then increased somewhat in the early 1990s (possibly due to the Mt. Pinatubo volcanic explosion), was reasonably stable from about 1995 to 2003, and has since been again in decline. We can also smooth the data using a wavelet transform, which we can apply directly to the snow cover data rather than anomaly data. I’ll set the time scale to be much shorter than for the Savitsky-Golay filter, so we’ll get a look at some of the faster fluctuations from year to year:

snowwave.jpg


There is of course more interannual variation in the wavelet smooth, because it’s tuned to detect that, but the overall picture is the same: a large decline during the 1980s, a smaller increase in the early 1990s, and a recent resumption of decline.

Wavelet analysis can show us not just the annual average NH snow cover, it can also quantify the amplitude of the annual cycle (the difference between peak and trough). Here’s a plot of the semi-amplitude (which is just half the amplitude):

Clearly, although average snow cover has declined over the years, the annual cycle has gotten bigger. This tells us that the decline isn’t the same throughout the year, instead there’s a seasonal pattern to it. In particular, with the cycle amplitude growing while the annual average declines, we can expect that most if not all of the decline in NH snow cover is occuring during the summer minimum.

We can further delineate this by computing annual averages for each season separately. Let’s take the usual climatological seasons, Dec-Jan-Feb for winter, Mar-Apr-May for spring, Jun-Jul-Aug for summer, and Sep-Oct-Nov for fall. Here’s the average NH snow cover anomaly over time, for the winter season:

winter.jpg


There’s been almost no change over the years; the trend in wintertime NH snow cover isn’t statistically significant. But for the spring season, it’s a different story:

t.gif


There’s quite a strong (and significant) trend, snow cover declining by about 64,000 km^2 per year. For summer the trend is even stronger:

summer.jpg


Summertime snow cover in the NH has been declining at an average rate of about 101,000 km^2/yr. For the fall season, we once again note no statistically significant decline

fall.jpg


The overall picture is now clear: during fall and winter, NH snow cover hasn’t really shown any trend over the last four decades, but in spring and summer it’s declined significantly, with its fastest decline during summer.

It seems to me that this sequence of events fits the pattern expected from global warming. Higher average temperatures cause earlier and greater snow melt, leading to significantly less summertime snow cover. But they also increase the total atmospheric water vapor, allowing more snowfall during winter to compensate the decrease caused by snow melt, leading to no net change in fall/winter snow cover. This is just speculation on my part, but it makes sense to me.

This much is beyond doubt: the effect of snow albedo on climate forcing is far greater during summer than winter, because that’s when the hemisphere receives the greatest sunlight and the impact of albedo is most important. When a region is in total darkness, albedo has no affect at all! Hence the decline in summer snow cover may have been a significant factor in the rapidly rising temperatures of the northern hemisphere land areas

http://tamino.wordpress.com/2008/04/09/summer-snow/
 

vitamos

Super Célula
Registo
11 Dez 2007
Mensagens
5,480
Local
Estarreja
Re: Seguimento Criosfera 2007/2008

Por mais que leia as diferentes correntes e as diferentes opiniões, por mais que entenda aqueles que crêem no aquecimento global, aqueles que dizem que este simplesmente não existe e por mais que se apresentem números e observações contraditórias, a informação fundamentada é sem dúvida o melhor ponto de análise! Problema é quando esta informação e observações bem fundamentadas levantam um outro mar de questões!

Esta visão mais neve Igual a mais água a evaporar tem fundamento! É verdade! Se atribuirmos causas humanas para este aqueciemento poderemos dizer que o ser humano tem muito a fazer! Mas a história da terra demonstra que as coisas não são bem assim! ISto se todos acreditarmos nas ICE AGES. Basicamente não estivemos lá para tirar fotos ou relatar os acontecimentos (Ai Mário, o que não terias delirado com isso ;) ). Acreditamos no papel de historiadores, de cientistas e evidências que vieram relatadas até aos dias de hoje. Mas sabemos também que os níveis das águas já foram superiores aos que são actualmente...

Basicamente voltamos á mesma história dos ciclos naturais difíceis de entender. Aqueles para as quais já encontrámos "n" explicações. Ás vezes abstenho-me de opinar neste tópico porque acho que não possuo a fundamentação científica necessária para este tema tão complexo... é bom ver que outros pesquisam, se interessam a fundo e conseguem transmitir a vontade de outros (como eu) aprenderem mais. Mas acho sinceramente que a compreensão do futuro passa também muito pelo entendimento do passado.

Ou seja e voltando ao início (porque não quero perder o fio do meu raciocínio), questão fácil e pertinente, quiçá básica da minha parte: Existia já o ser humano, poluidor, irresponsável, o mundo industrializado, o CO2, os gases com efeito de estufa, etc, etc... em décadas, séculos, milénios, eras que nos antecederam, para tamanha revolução ao longo dos tempos no nosso planeta. Obviamente que não! Agora será este argumento apenas uma desculpa para nada fazer... e se fizermos algo será que teremos um suavizar de um caos que muitos prevêm ou estaremos a acelarar tudo isto...:huh:

Desculpem o longo desabafo... é para compensar as vezes que tou aqui caladinho a ler os vossos interessantes pensamentos :p


EDIT: Por momentos perdi-me e pensei que estava no tópico "há mesmo aquecimento global". Os temas tão muito próximos, penso que o que disse não está desenquadrado porque vem a propósito do tópico aqui presente.
 
  • Gosto
Reactions: belem

LUPER

Nimbostratus
Registo
20 Nov 2005
Mensagens
1,945
Local
Aveiro
Re: Seguimento Criosfera 2007/2008

Esses textos são todos muito bons, mas escamoteam o Hemisferio Sul porquê? Então se tivermos mais gelo e mais frio, mesmo assim continuamos a ter aquecimento global? E se tivermos menos água e mais calor?Também continua a ser aquecimento global? Então se percebo bem, basicamente é tudo originado pelo aquecimento global? Ou eu é que estou a entender mal?:rolleyes::huh::huh::huh:
 

Vince

Furacão
Registo
23 Jan 2007
Mensagens
10,624
Local
Braga
Os dados da criosfera até Março indicam que em Março o Ártico embora ainda bastante abaixo da média recuperou para niveis superiores aos últimos 4 anos, e o Antártico soma e segue com a maior cobertura dos últimos 30 anos para esse mês.

According to the National Snow and Ice Data Center, the March 2008 Northern Hemisphere sea ice extent, which is measured from passive microwave instruments onboard NOAA satellites, was below the 1979-2000 mean, but greater than the previous four years. This was the sixth least March sea ice extent on record. The past four years had the least March sea ice extent since records began in 1979. Sea ice extent for March has decreased at a rate of 2.8%/decade (since satellite records began in 1979) as temperatures in the high latitude Northern Hemisphere have risen at a rate of approximately 0.37°C/decade over the same period.
hn.gif

http://www.ncdc.noaa.gov/oa/climate/research/2008/mar/global.html#seaice


Meanwhile, the March 2008 Southern Hemisphere sea ice extent was much above the 1979-2000 mean. This was the largest sea ice extent in March (28.6% above the 1979-2000 mean) over the 30-year historical period, surpassing the previous record set in 1994 by 10.9%. Sea ice extent for March has increased at a rate of 4.2%/decade.
hs.gif

http://www.ncdc.noaa.gov/oa/climate/research/2008/mar/global.html#seaice


Olhando para alguns mais recentes, o Ártico em finais de Abril recuperou ainda mais e está acima dos niveis dos últimos 6 anos atrás.

artico.gif
 

Vince

Furacão
Registo
23 Jan 2007
Mensagens
10,624
Local
Braga
Ponto de situação da Criosfera:

O Hemisfério sul continua excelente e assim deverá continuar visto que vamos agora entrar no Inverno.

sul.png


O Ártico depois de em Abril ter recuperado para niveis superiores aos dos últimos 6 anos parece agora começar a fraquejar um pouco.

norte.png


Ainda assim, para a data mantem-se num nivel razoável comparativamente aos últimos anos, embora estes últimos anos estejam todos eles abaixo da média.

AMSRE_Sea_Ice_Extent.png
 

José M. Sousa

Cumulus
Registo
16 Mai 2008
Mensagens
258
Local
Lisboa
Ponto de situação da Criosfera:

O Hemisfério sul continua excelente e assim deverá continuar visto que vamos agora entrar no Inverno.


O Ártico depois de em Abril ter recuperado para niveis superiores aos dos últimos 6 anos parece agora começar a fraquejar um pouco.

Em relação ao Árctico, há este senão em relação à recuperação do gelo:

Yes, I know you’ve all heard we’ve had “record” refreezing of Arctic ice. Big shock, there. We had record melting followed by a temporary cooling La Niña event. What those denier/delayer-1000 talking points don’t tell you is that the refrozen ice is very thin and still at record low levels following the staggering ice loss this summer.

http://climateprogress.org/2008/03/19/noaanasansidc-arctic-ice-is-alarmingly-scarce-and-thin/

Já agora sobre a Antárctica:

http://climateprogress.org/2008/03/...f-disintegration-underscores-a-warming-world/

«Satellite imagery from the [NSIDC] reveals that a 13,680 square kilometer (5,282 square mile) ice shelf has begun to collapse because of rapid climate change in a fast-warming region of Antarctica.…»
 

Vince

Furacão
Registo
23 Jan 2007
Mensagens
10,624
Local
Braga
Já agora sobre a Antárctica:
http://climateprogress.org/2008/03/...f-disintegration-underscores-a-warming-world/
«Satellite imagery from the [NSIDC] reveals that a 13,680 square kilometer (5,282 square mile) ice shelf has begun to collapse because of rapid climate change in a fast-warming region of Antarctica.…»


Sim, quanto ao Ártico a cobertura não quer dizer muito, a espessura obviamente é reduzida, vamos esperar para ver o que se passa este ano em Setembro e nos próximos anos.

Mas quanto à Antárctica, eu já conhecia a notícia dessa quebra mas não lhe dou muita importância, o tom enquadro-o pessoalmente na categoria "alarmismo" não muito bem fundamentado do lado dos warmers. Até pode de facto ser causado pelo aquecimento da última década, mas acho que com ou sem aquecimento, certamente no passado o gelo se quebrou desta forma muitas outras vezes, quanto mais não seja por razões estruturais, regime de ventos, etc,etc. Com uma La Nina forte que agora estará a terminar o hemisfério sul tem tido temperaturas baixas. Se o gelo quebrou acho que não foi por causa do calor, as próprias imagens parecem mostrar um colapso estrutural que provavelmente um dia ocorreria de qualquer forma, com ou sem aquecimento antropogénico. No passado se calhar ocorreu ouutras vezes e não havia ninguém para o registar. Eventualmente poderia ser a água mais quente, mas até aí parece que não é esse o caso conforme umas pesquisas recentes, há uma zona mais quente mas muitas outras estão bem frias.
É apenas uma opinião pessoal sobre o assunto.
 

José M. Sousa

Cumulus
Registo
16 Mai 2008
Mensagens
258
Local
Lisboa
Mas quanto à Antárctica, eu já conhecia a notícia dessa quebra mas não lhe dou muita importância, o tom enquadro-o pessoalmente na categoria "alarmismo" não muito bem fundamentado do lado dos warmers.

Mais vale prevenir:


http://www.windows.ucar.edu/tour/link=/earth/polar/cli_antarcticpenn.html

Warming on the Antarctic Peninsula
A view of the Larson B Ice Shelf (Antarctica) breaking apart in 2002, compiled using MODIS images
Courtesy of the National Snow and Ice Data Center

The Antarctic Peninsula, the part of Antarctica furthest from the South Pole, has been warming rapidly, five times faster than the global average. Since 1945, the Antarctic Peninsula has warmed about 4.5°F (2.5°C).

Some of the most dramatic impacts of warming are collapsing ice shelves. Since 1974, 6760 square miles (17,500 square kilometers) of ice have collapsed into the Southern Ocean. The animation at the left shows the time-lapse breakup of the Larsen B ice shelf. When an ice shelf collapses into the ocean, the glacier it was connected to on shore is less supported. Scientists are finding that Antarctic glaciers are moving more quickly towards the ocean once an ice shelf is gone.

The waters of the Southern Ocean are also warming. Warmer ocean water speeds the melting of ice shelves and it is having an impact on the sensitive marine ecosystem of the Southern Ocean too. The number of Antarctic krill, an important animal near the bottom of the Southern Ocean food chain, may be shrinking because of warming waters and melting sea ice. Less winter sea ice has also affected penguins in the region. Areas of the Antarctic Peninsula that were once lively Adelie penguin colonies are now abandoned. The remains of their simple rock nests litter the landscape. (To take a look at an abandoned colony, click here.) Many of these penguins have moved south to areas that are colder.

Unlike the rapidly warming Antarctic Peninsula, temperatures in the interior of the Antarctic continent do not appear to be rising. However, global climate models indicate that Antarctica will become warmer in the future.
 

ecobcg

Super Célula
Registo
10 Abr 2008
Mensagens
5,146
Local
Sitio das Fontes e Carvoeiro (Lagoa - Algarve)
Polo Norte poderá ficar sem gelo este Verão

"Ambiente: Polo Norte poderá ficar sem gelo este Verão - especialistas norte-americanos
28 de Junho de 2008, 11:17

Madrid, Espanha 28 Jun (Lusa) - O Pólo Norte poderá ficar sem gelo este Verão devido ao aquecimento global, alertaram investigadores do Centro de Dados sobre Gelo e Neve dos Estados Unidos.

Segundo os cientistas, a possibilidade do gelo que cobre o Ártico derreter é de mais de 50 por cento devido à camada espessa de gelo, que durante muitos anos cobriu a região, ter vindo a derreter e ter sido substituída por uma enorme placa de gelo fino, que pode facilmente derreter com o Verão.

O aumento generalizado das temperaturas, a causa do aquecimento global, está a afectar também, e de forma grave, as regiões polares do planeta, referem os cientistas citados pelo jornal espanhol 'El País'.

Os cientistas temem agora que o desaparecimento de uma parte importante do gelo leve a outra consequência: o oceano absorva mais calor e faça aumentar ainda mais as temperaturas do clima local.

Se isto ocorresse originaria um problema no meio-ambiental, mas também político, uma vez que as nações com territórios no Oceano Glaciar Ártico poderiam aceder com mais facilidade aos valiosos recursos naturais desta zona do planeta, ainda por explorar.
"

HN

Lusa/fim
in SOL

Mais um estudo sobre o tema!