Alterações Climáticas: Medição da temperatura global

Vince

Furacão
Registo
23 Jan 2007
Mensagens
10,624
Local
Braga
Através do Meteored fui parar a um blogue interessante. Dum meteorologista americano chamado Anthony Watts, que está a questionar os dados das estações meteorológicas americanas, e por consequência, a temperatura global. Ele deu-se ao trabalho de visitar pessoalmente algumas dezenas de estações, e o que descobriu foi um pouco chocante. Muitas delas estavam pessimamente localizadas. Especula o autor, que muitas estações estão em ambiente urbano ou próximo, e destas umas quantas estão mal muito localizadas, dando seguramente origem a erros. Numa escala global, isto geraria um erro razoável, ao qual se junta a muito menor quantidade de estações em grandes extensões de terra onde não existe tanta presença humana.

Até que ponto estaremos a medir bem a temperatura da Terra ? Não poderá estar aí uma possível explicação para as diferenças do hemisfério norte vs. sul ? E se se gastam fortunas em investigação, cientistas, recursos, satélites e simulações, mas depois alguns dos dados de base que entram nos modelos não estão correctos porque muitas estações espalhadas pelo mundo estão meio esquecidas ou quase abandonadas?

É mais uma teoria, discutível certamente, mas tem pelo menos alguma lógica interessante.
E em Portugal ? Estará tudo bem configurado e localizado, e com uma boa distribuição entre zonas urbanas e rurais, etc, etc ?

O blogue em questão é este:
Watts Up With That? How not to measure temperature
http://www.norcalblogs.com/watts/weather_stations/

A pessoa em questão entretanto lançou um projecto na Net chamado SurfaceStations onde utilizadores de todo o país são convidados a verificar e documentar a situação das estações meteorlógicas das suas áreas de residência e a submeterem a informação para uma base dados. Independentemente da teoria parece-me uma ideia interessante, e que até poderia ser feito a nivel global.

SurfaceStations
http://www.surfacestations.org/


Helping along global warming

Remember in January when the National Oceanic & Atmospheric Administration (NOAA) and its good friends in media trumpeted that 2006 was the warmest year on record for the contiguous United States?

NOAA based that finding - which allegedly capped a nine-year warming streak "unprecedented in the historical record" - on the daily temperature data that its National Climatic Data Center gathers from about 1,221 mostly rural weather observation stations around the country.

Few people have ever seen or even heard of these small, simple-but-reliable weather stations, which quietly make up what NOAA calls its United States Historical Climatology Network (USHCN).

But the stations play an important role in detecting and analyzing regional climate change. More ominously, they provide the official baseline historical temperature data that politically motivated global-warming alarmists like James Hansen of NASA plug into their computer climate models to predict various apocalypses.

NOAA says it uses these 1,221 weather stations -- which like the ones in Uniontown and New Castle are overseen by local National Weather Service offices and usually tended to by volunteers -- because they have been providing reliable temperature data since at least 1900.

But Anthony Watts of Chico, Calif., suspects NOAA temperature readings are not all they're cracked up to be. As the former TV meteorologist explains on his sophisticated, newly hatched Web site surfacestations.org, he has set out to do what big-time armchair-climate modelers like Hansen and no one else has ever done - physically quality-check each weather station to see if it's being operated properly.

To assure accuracy, stations (essentially older thermometers in little four-legged wooden sheds or digital thermometers mounted on poles) should be 100 feet from buildings, not placed on hot concrete, etc. But as photos on Watts' site show, the station in Forest Grove, Ore., stands 10 feet from an air-conditioning exhaust vent. In Roseburg, Ore., it's on a rooftop near an AC unit. In Tahoe, Calif., it's next to a drum where trash is burned.

Watts, who says he's a man of facts and science, isn't jumping to any rash conclusions based on the 40-some weather stations his volunteers have checked so far. But he said Tuesday that what he's finding raises doubts about NOAA's past and current temperature reports.

"I believe we will be able to demonstrate that some of the global warming increase is not from CO2 but from localized changes in the temperature-measurement environment."

Meanwhile, you probably missed the latest about 2006. As NOAA reported on May 1 - with minimum mainstream-media fanfare - 2006 actually was the second- warmest year ever recorded in America, not the first. At an annual average of 54.9 degrees F, it was a whopping 0.08 degrees cooler than 1998, still the hottest year.

NOAA explained that it had updated its 2006 report "to reflect revised statistics" and "better address uncertainties in the instrumental record." This tinkering is standard procedure. NOAA always scientifically tweaks temperature readings for various reasons -- weather stations are moved to different locations, modernized, affected by increased urbanization, etc.

NOAA didn't say whether it had adjusted for uncertainties caused by nearby burn barrels.

http://www.pittsburghlive.com/x/pittsburghtrib/opinion/columnists/steigerwald/s_513013.html


Rog

Cumulonimbus
Registo
6 Set 2006
Mensagens
4,515
Local
Norte Madeira (500m)
Re: Estaremos a medir bem a temperatura global ?

Através do Meteored fui parar a um blogue interessante. Dum meteorologista americano chamado Anthony Watts, que está a questionar os dados das estações meteorológicas americanas, e por consequência, a temperatura global. Ele deu-se ao trabalho de visitar pessoalmente algumas dezenas de estações, e o que descobriu foi um pouco chocante. Muitas delas estavam pessimamente localizadas. Especula o autor, que muitas estações estão em ambiente urbano ou próximo, e destas umas quantas estão mal muito localizadas, dando seguramente origem a erros. Numa escala global, isto geraria um erro razoável, ao qual se junta a muito menor quantidade de estações em grandes extensões de terra onde não existe tanta presença humana.

Até que ponto estaremos a medir bem a temperatura da Terra ? Não poderá estar aí uma possível explicação para as diferenças do hemisfério norte vs. sul ? E se se gastam fortunas em investigação, cientistas, recursos, satélites e simulações, mas depois alguns dos dados de base que entram nos modelos não estão correctos porque muitas estações espalhadas pelo mundo estão meio esquecidas ou quase abandonadas?

É mais uma teoria, discutível certamente, mas tem pelo menos alguma lógica interessante.
E em Portugal ? Estará tudo bem configurado e localizado, e com uma boa distribuição entre zonas urbanas e rurais, etc, etc ?

O blogue em questão é este:
Watts Up With That? How not to measure temperature
http://www.norcalblogs.com/watts/weather_stations/

A pessoa em questão entretanto lançou um projecto na Net chamado SurfaceStations onde utilizadores de todo o país são convidados a verificar e documentar a situação das estações meteorlógicas das suas áreas de residência e a submeterem a informação para uma base dados. Independentemente da teoria parece-me uma ideia interessante, e que até poderia ser feito a nivel global.

SurfaceStations
http://www.surfacestations.org/

Essa é uma boa questão, não pegando nisto e criar uma teoria da conspiração é certo que algumas estações podem não estar nas melhores condições e bem posicionadas. Mas pensar que este é um problema recente e utilizar esta situação como argumento da subida da temperatura global.. vai uma grande distância. Seria pensar que numa data hipotêtica no passado todas as estações estavam a funcionar em pleno sem problemas.. mas tal nunca aconteceu...
Primeiro porque o problema não é dos últimos anos... são tantas as estações a debitar dados que muitas delas desde a sua implementação foram mal localizadas e os erros muitas têm-nos desde que começaram a funcionar. Outras, bem localizadas sofrem os efeitos da degradação do material de protecção e de limpeza das redondezas e com dados que acabam por ter uma margem de erro superior. Quantas estações estão votadas ao abandono, desde que estejam a funcionar é o que importa, outras já nem dados fornecem.
Mas nem todas as estações estão assim tão despresadas e fornecem dados com grande rigor. É certo que é necessário investir mais na manutenção destas estações automáticas para um maior rigor.
 

Minho

Cumulonimbus
Registo
6 Set 2005
Mensagens
4,091
Local
Melgaço
Re: Estaremos a medir bem a temperatura global ?

Essa é uma boa questão, não pegando nisto e criar uma teoria da conspiração é certo que algumas estações podem não estar nas melhores condições e bem posicionadas. Mas pensar que este é um problema recente e utilizar esta situação como argumento da subida da temperatura global.. vai uma grande distância. Seria pensar que numa data hipotêtica no passado todas as estações estavam a funcionar em pleno sem problemas.. mas tal nunca aconteceu...
Primeiro porque o problema não é dos últimos anos... são tantas as estações a debitar dados que muitas delas desde a sua implementação foram mal localizadas e os erros muitas têm-nos desde que começaram a funcionar. Outras, bem localizadas sofrem os efeitos da degradação do material de protecção e de limpeza das redondezas e com dados que acabam por ter uma margem de erro superior. Quantas estações estão votadas ao abandono, desde que estejam a funcionar é o que importa, outras já nem dados fornecem.
Mas nem todas as estações estão assim tão despresadas e fornecem dados com grande rigor. É certo que é necessário investir mais na manutenção destas estações automáticas para um maior rigor.


Basta olhar para a estação de Lamaçães em Braga... no comments... :angry: :angry: :mad:

http://www.meteopt.com/showthread.php?t=959


161801.JPG
 

GranNevada

Cumulus
Registo
27 Ago 2005
Mensagens
335
Local
Braga
Re: Estaremos a medir bem a temperatura global ?

Pois é Minho . Em vez de estar branquinha está quase a ficar pretinha ... logo , temperaturas mais altas de certeza devido a maior absorção de radiação solar :angry:

162754.JPG
 

Minho

Cumulonimbus
Registo
6 Set 2005
Mensagens
4,091
Local
Melgaço
Re: Estaremos a medir bem a temperatura global ?

Outra coisa ainda sobre a medição das temperaturas actualmente. A medição por satélite é fiável? Se é, este deveria ser o método por excelência para medir a temperatura global. Outro método que também acho que seria válido seria ter mais em conta as temperaturas do ar obtidas pelas bóias. Estas estão de certeza longe de qualquer fonte de calor e inseridas num meio que não se altera rapidamente só com uma vaga de calor ou uma vaga de frio. Penso que estamos a chegar ao um momento que se deveria reflectir o modo como e onde estão a ser feitas as leituras para que de aqui a trinta anos não estejamos a comparar as normais com dados errados...
 

Daniel Vilão

Super Célula
Registo
22 Mar 2007
Mensagens
6,979
Local
Ribafria-Alenquer / Moscavide / Degracia
Re: Estaremos a medir bem a temperatura global ?

Acontece que moro num prédio, pelo que o sensor, para apanhar o maximo de ar fresco e vento possível, está colocado perto da parede e da janela das traseiras, pendurado no exterior.
Não tenho hipótese de o colocar num sítio melhor, pois não tenho nehum espaço de grande área que seja aberto, apenas uma varanda (o que não chega, pois há paredes que estão próximas, janelas...)
Fiz comparações com um termómetro de mercúrio na varanda da mesma casa e descobri que o sensor faz uma leitura de temperatura ligeiramente superior ao real.

Como resolvi o problema?

Da maneira mais prática e fiável que achei: retirando essa diferença ao que diz o sensor.
Ou seja, se a diferença for de 2 ºC e se o sensor reportar uma temperatura de 19 ºC, eu direi que estão 17 ºC.

Confirmo constantemente com um termómetro de mercúrio para me certificar de que a medição é fiável e posso dizer que funciona.
Aliás, as temperaturas que eu divulgo já têm este débito aplicado, senão teriam algum desfasamento em relação à realidade.
 

Vince

Furacão
Registo
23 Jan 2007
Mensagens
10,624
Local
Braga
Re: Alterações Climáticas: Medição Temperatura global

Mais um post sobre a discussão da medição da temperatura global, desta vez do Climate Audit, em que eles a propósito do erro americano (ver este topico) falam da medição de temperaturas em Africa, América do Sul e Antártida.

Waldo in Africa
By Steve McIntyre

Gavin Schmidt and James Hansen say that errors in the U.S. “don’t matter” because it is only 2% of the earth’s surface (about 6% of the land surface). This implies that the accuracy of measurements in other parts of the world can be relied on. In the U.S. the 1930s have a similar level to recent levels, while the ROW has a striking difference. The surface area of Africa (30,300,000 km² ) is about one-fifth of the Earth’s land surface. 148,939,100 km²), about 4 times the size of the contiguous 48. I guess that this would be a good place to look for the high-quality stations that Schmidt and Hansen are counting on.

From the collated GISS data set, I selected those stations meeting the following criteria:
1) country code less than 200 (yielding Africa plus, as it turns out, a couple of islands;
2) designated R for “rural” by GHCN/GISS (taking no position on whether this is accurate)
3) beginning by 1931 (to cover the 1930s) and ending after 1990.

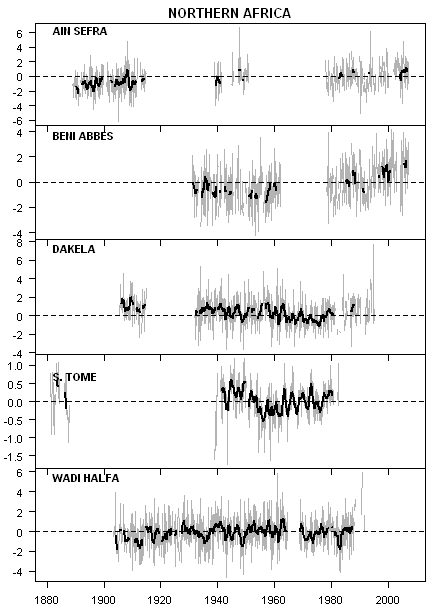
This yielded a grand total of 10 stations (of which 2 are oceanic islands), which are shown below, with the ones in the first graphic being more northerly and the ones on the left, more southerly.

A few observations about the Africa Ten. My search required that there be values post-1990 and yet some of the graphics appear to end much earlier. For Sao Tome, for example, there are a couple of oddball singleton readings in the 1980s and one in the 1990s, which triggered its inclusion here, although the record is obviously not a continuous record into the 1990s. An inspection of the Ain Sefra suggests at least the possibility of inhomogeneity in the decades-long interval between measurements.

africa30.gif


So if you’re looking here for information from rural sites in Africa that show the relative levels of 1934 and 1998, there’s not a lot to go on. There are relatively long records from St Helena and the Seychelles; both of these data sets are interesting and probably quite valuable, but they don’t per se give a lot of information on Africa. The only candidate station, Mongu, shows elevated 1930s, with 1934 appearing to be warmer in Mongu than 1998, as in the United States.

To move past this data set, Hansen has to blend in urban sites, which, even Hansen says should be avoided in climate studies. It doesn’t seem like one can draw very forceful conclusions about relative land temperature levels in Africa between the 1930s and the present from these rural sites.
(c) Climate Audit


Where’s Waldo: Antarctica #2
If you’ve not read Where’s Waldo: Antarctica #1, please do so first.

Waldo in Antarctica #1 compares measured rural station temperatures in Antarctica in the 1930s and recently. It is of course empty because there were no such measurements in the 1930s. So when Hansen says that temperatures in the U.S. don’t “matter” because it’s only 2% of the earth’s surface (6% of the land surface actually), it’s a bit deceptive for analysis of relative levels in the 1930s because, as we are finding out, there are no relevant measurements from the 1930s for much of Hansen’s denominator.

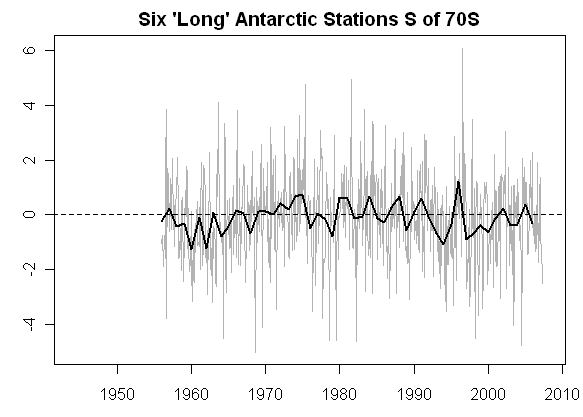
Two stations started in the Antarctic Peninsula in the 1940s and there were 12 more by the late 1950s, 6 of which were south of 70S and 6 of which were north of 70S. I show averages for the three groups separately below.

First here is a plot for the six “very high latitude” stations since the 1950s. Obviously they don’t cover the 1930s, but I am unable to discern the Waldo trend here at very high latitudes.

antarc33.gif


Second here is a plot for the six non-Peninsula stations north of 70 S. Again I am unable to find the Waldo trend here.

antarc34.gif


Third here is a plot for the two Antarctic Peninsula stations, which while, they don’t show the 1930s, do show a definite temperature increase over their history. There is a long record at Puntas Arenas in southern Chile which doesn’t have a Waldo-trend though, so whatever trend is taking place in the Antarctic Peninsula doesn’t appear to extend to southern South America. For reference, the Antarctic Peninsula (about the latitude of Norway) is where the Larsen ice shelves have broken off.

antarc35.gif


Any day now, I anticipate that Michael Mann and his school will show (using Mannian RegEM or some other “new” method not used off the Island and buried within 10,000 pages of covariance calculations) that there is a teleconnection between these Antarctic Peninsula stations and bristlecone pines, thereby proving that 1998 was the warmest year in the Holocene to 23 significant decimal places.

As I’ve discussed elsewhere (and readers have observed), IPCC AR4 has some glossy figures showing the wonders of GCMs for 6 continents, which sounds impressive until you wonder - well, wait a minute, isn’t Antarctica a continent too? And, given the theory of “polar amplification”, it should really be the first place that one looks for confirmation that the GCMs are doing a good job. Unfortunately IPCC AR4 didn’t include Antarctica in their graphics. I’m sure that it was only because they only had 2000 or so pages available to them and there wasn’t enough space for this information.
(c) Climate Audit

Waldo: South America
Waldo, Hansen’s ROW trend, is not in Africa nor in Antarctica. Is Waldo in South America?

Here we are referring to a trend calculated according to the stated methodology of Hansen et al 1999, 2001, in which urbanization effects are supposedly removed by coercing trends to trends of rural stations. For that purpose, I am assessing the availability of rural stations which go back to the 1930s - thereby permitting a comparison of 1934 to 1998 in these other regions under Hansen’s adjustment - while also having sufficient information to permit a 1961-1990 normal to be calculated.

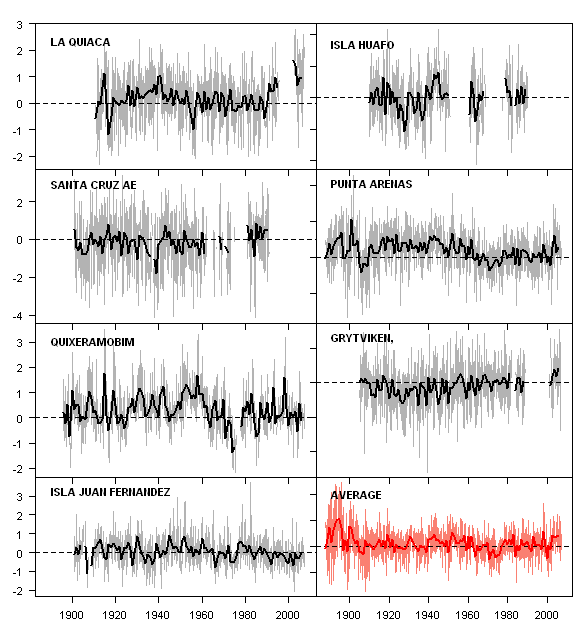
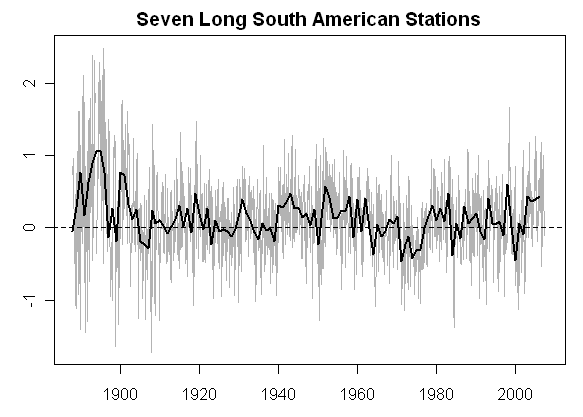
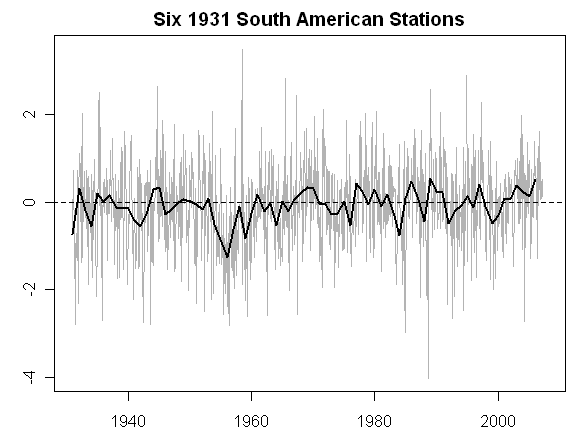
South America has a land area of 17.8 million km2 (about 12% of the world’s land surface) and is over twice the size of the contiguous 48. There are 7 stations with records that include all the 1930s, shown below together with their anomaly average. I noticed that 6 stations start in 1931 and I show them below separately.

Three of the stations are islands: Isla Juan Fernandez, Isla Huafo and Grytviken (South Georgia) - only 4 on the mainland. The first two (columnwise) are in Argentina, Q is in Brazil, the next 3 in Chile and the last is again South Georgia. Punta Arenas is quite far south (53 S) and provides an interesting counterpoint to the shorter records from the Antarctic Peninsula, showing strong warming since the 1940s.

Obviously several of the records have major discontinuities. We know from the U.S. HCN analyses that very slight changes in station location can create biases that Karl needs to adjust through his TOBS adjustment, MMTS adjustment, station history adjustment etc. and that in the U.S. these station adjustments are not small (actually a collation of USHCN adjustments needs to be made to get a distribution to specify the distributions that might be at work when one ventures to other countries. Is there a possibility that, for example, some discontinuity occurred at Isla Huafo or Quiaca during the decades long interval between measurements? Seems to me to be at least a possibility? If one is taking an average, this becomes relevant because the later values of Quiaca show a step increase towards the end not apparent in the continuous series - which gets reflected in the average.

waldo_37.gif

On a larger scale, here is the average of the seven long records (bottom right hand red above):

waldo_36.gif


For completeness, here is the average of the six records commencing in 1931:

waldo_38.gif


A few posters are criticizing me for apparently focusing on areas with poor coverage. I don’t think that anyone can accuse me of not discussing American stations in sufficient detail - so this is a little unfair. I’ve posted extensively earlier in the year on China and Russia and passim on Australia. I’ll probably get to them again. But there’s only so much that I can do. If a critic feels that some area with good records is being given short shrift because I haven’t got to it yet, please feel free to write a post of detail equivalent to mine and I;ll post it.
(c) Climate Audit