Clima Global - Evolução mensal

Vince

Furacão
Registo
23 Jan 2007
Mensagens
10,624
Local
Braga
Abril/2007

O National Climatic Data Center já publicou a análise do mês de Abril.
Com aquela forte e excepcional influência anti-ciclónica no centro da Europa durante boa parte do mês de Abril, não era difícil de prever o conteúdo desta análise.

Climate of 2007 - April in Historical Perspective
National Climatic Data Center 15 May 2007


...
Global Highlights
The combined global land and ocean surface temperature for April was the third warmest on record (1.19°F/0.66°C above the 20th century mean). For the January-April year-to-date period, the global surface temperature ranked warmest on record.

Separately, the global April land-surface temperature was the warmest on record. Monthly mean temperatures more than 5°F (3°C) above average covered large parts of Asia and Western Europe. The April ocean-surface temperature tied for seventh warmest in the 128-year period of record as neutral ENSO (El Niño-Southern Oscillation) conditions persisted in the equatorial Pacific (awaiting update to indices).

During the past century, global surface temperatures have increased at a rate near 0.11°F (0.06°C) per decade, but the rate of increase has been three times larger since 1976, or 0.32°F (0.18°C) per decade, with some of the largest temperature increases occurring in the high latitudes of the Northern Hemisphere.

Link:
http://www.ncdc.noaa.gov/oa/climate/research/2007/apr/apr07.html


eventosxe1.gif


apriliw3.gif


aprilye4.gif


Janeiro - Abril 2007

currentoc0.gif


Vince

Furacão
Registo
23 Jan 2007
Mensagens
10,624
Local
Braga
Maio/2007

Maio/2007

Mais um relatório mensal do National Climatic Data Center, publicado aqui:

Climate of 2007 - May in Historical Perspective
National Climatic Data Center - 14 June 2007

Resumo:
* 4º mês de Maio mais quentes dos registos , +0.53°C acima da média ( Terra e Oceanos)
* Mês de Maio mais quente dos registos (Apenas Terra)
* Período combinado Janeiro-Maio mais quente dos registos.


Global Highlights
The combined global land and ocean surface temperature for May was the fourth warmest on record, 0.95°F/0.53°C above the 20th century mean. The global surface temperature for the combined January-May period tied with 1998 as the warmest January-May on record.

Separately, the global land-surface temperature was the warmest on record for May, as well as for boreal spring (March-May) and the year-to-date period. The May ocean-surface temperature was the ninth warmest in the 128-year period of record as near-average to cooler-than-average conditions were present across the equatorial Pacific.

During the past century, global surface temperatures have increased at a rate near 0.11°F (0.06°C) per decade, but the rate of increase has been three times larger since 1976, or 0.32°F (0.18°C) per decade, with some of the largest temperature increases occurring in the high latitudes of the Northern Hemisphere.


Principais Eventos

eventossz1.gif


Anomalias Temperaturas Maio/2007

01yy6.gif


Anomalias Temperaturas Março-Maio/2007

02eg8.gif


Anomalias Precipitação Maio/2007

03ha2.gif


Anomalias Precipitação Março-Maio/2007

04tw3.gif


Rank

rankfc9.gif


Comentário e análise:
Vamos lá a ver o que sai daqui a um mês sobre Junho. Estou a ficar muito curioso em relacção ao Hemisfério Sul dado os acontecimentos que tem sido descritos nas últimas semanas aqui no Forum.

Esperava a nível global um melhor resultado (menos quente) para Maio, mas mesmo assim o mês já não foi tão grave como Abril.
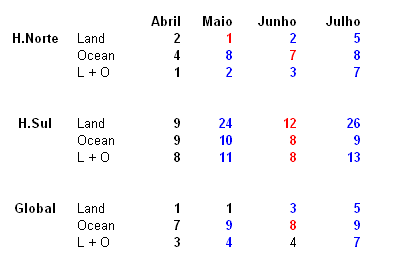
Fiz uma pequena imagem com a evolução dos ranking's: Só houve um record que piorou: Land no hemisfério norte, e acho que deveriam ter feito alguma menção a isso no resumo, mas pronto, já sabemos o que a casa gasta.

registosrl2.gif
 

Vince

Furacão
Registo
23 Jan 2007
Mensagens
10,624
Local
Braga
Saiu ontem mais um relatório do NCDC, o de Junho

Climate of 2007 - June in Historical Perspective

Anomalously warm temperatures have covered much of the globe throughout the year. The January-June 2007 temperature anomalies were warmer than average across all land areas, with the exception of Argentina. Warmer than average Sea Surface Temperatures (SSTs) occured in the equatorial Pacific, Atlantic and the Indian oceans. Cooler than average conditions were observed in the northeastern Pacific and some areas in the southern oceans.

During June, there were above average temperatures across Europe, eastern Brazil, northwestern Africa, and most of Asia and the contiguous U.S. Cooler-than-average conditions occurred in in Australia, Argentina, western Russia, and the southcentral U.S. Warmer than average SSTs occurred in the Atlantic Ocean, North Indian Ocean, and the western equatorial Pacific Ocean. SST anomalies in the Niño 3.4 region were representative of a neutral ENSO phase. Please see the latest ENSO discussion for additional information.

The mean position of upper level ridges of high pressure and troughs of low pressure (depicted by positive and negative 500-millibar height anomalies on the June map) are generally reflected by areas of positive and negative temperature anomalies at the surface, respectively.


93128974mx2.gif


57904255ed0.gif


48059099yz3.gif


47387215eq4.gif


E o meu esquema mensal também:
A coisa comparativamente piorou onde eu esperava melhorias... no Hemisfério Sul :huh:

17696665bl3.gif
 
Registo
25 Jun 2007
Mensagens
143
Local
Benfica - Lisboa
Bem, tenho estado em cima do assunto da La Ninã e modelos atras de modelose isso mas a NOAA confirmou que nao ah ca la ninã p ninguem. Entao como e que justificam isto o que se esta a passar? Parece que as Teorias do AG e so palha!
Penso que isto tudo esta acontecer devido ao Sol. Vamos por partes. O sol e a nossa fonte de energia, e é ele que ajuda a regular tudo isto que se passa ca no nosso Planeta. Mas temos tambem que ver com o que se esta a passar com a Terra. Estou a referir duma coisa ja mto falada. O ciclo que ela esta a passar, devido a inclinação dos Eixos. Penso que isso altera e muito as funcionalidades que o Sol tem sobre o nosso planeta e acho que esse acontecimento é a principal causa da alteração do nosso clima como tambem dos recursos naturais e ate mesmo na sismologia. ja pensaram que basta haver uma alteração qualquer que seja a nivel do nosso planeta para que a radiação vinda do sol nao acerta em cheio no devido local? Por outras palavras, basta uma simples alteração do nosso palenta a nivel do eixo como se esta a passar, para que os raios solares ou radiacoes como queiram chamar-lhes nao incidem correctamente na Terra. Ora se isso nao acontecer.....e a bomba autentica, altera tudo.. Entao como e que justifcam o caso de ah milhares de anos ( nao havia o Homem obvio ) ter-se dado as primeiras tempestades, e a formação da atmosfera etc etc ect? Qual foi o principal factor para que se tenha dado isso tudo, essas reacções? O sol claro, e é pefeitamente normal que mesmo estando cá o Homem essas reaccoes estejam ainda a desenvolver-se constantemente . Ja pensaram nisso ? Entao e bom que pensem, alias e a minha teoria mas pontos e o que eu acho


tenho dito!
Bom fim de semana e mta night
 

Vince

Furacão
Registo
23 Jan 2007
Mensagens
10,624
Local
Braga
Julho 2007

Relatório de Julho 2007 do NCDC:

http://www.ncdc.noaa.gov/oa/climate/research/2007/jul/jul07.html

Introdução:
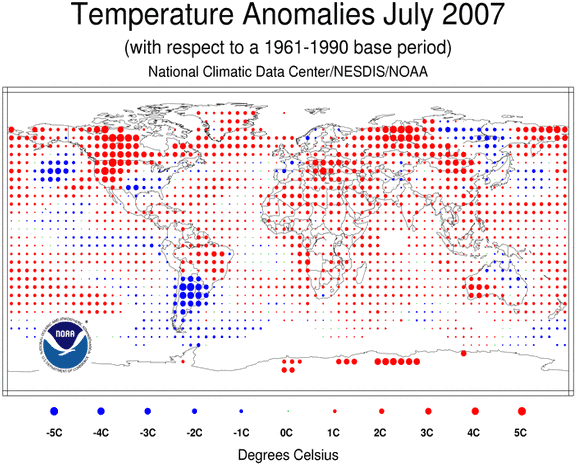
Anomalously warm temperatures have covered much of the globe throughout the year. The January-July 2007 map of temperature anomalies shows the presence of warmer-than-average temperatures across all land areas, with the exception of Argentina. Warmer-than-average Sea Surface Temperatures (SSTs) occurred in the Atlantic, Indian, and the Northwest Pacific oceans. Cooler-than-average conditions were observed in the Niño 1+2 and 3 regions, the northeastern Pacific and some areas in the southern oceans.

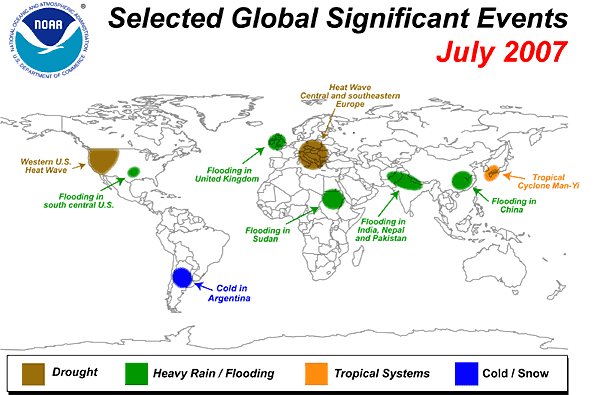
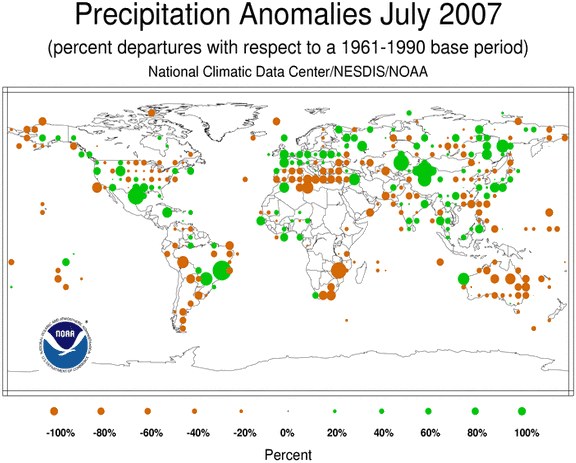
During July, there were above average temperatures across the western U.S., central and southeastern Europe, eastern Brazil, northwestern Africa, southeastern Australia, and most of Asia. The western U.S. and central and southeastern Europe suffered from severe heat waves which caused temperatures to exceeded 40°C (104°F) during July. Additional details on the effects of the heat waves can be found on the July Global Hazards page. Cooler-than-average conditions occurred in the southern Plains to the eastern Great Lakes of the contiguous U.S., southern parts of South America, eastern parts of Asia, and northern Australia. Meanwhile, SST anomalies in the Niño 3.4 region cooled slightly in July, but a neutral ENSO phase persisted. Please see the latest ENSO discussion for additional information.


Eventos significativos:

sig07.gif


Anomalias

temp07.gif


prec07.gif


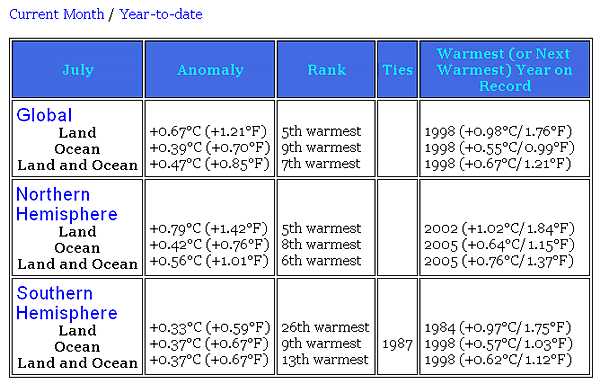
Ranking

rank.gif


Evolução Mensal do Ranking
A minha tabelinha de evolução. Em Julho em termos de ranking finalmente por uma vez tudo azul.

rank07.gif
 

Vince

Furacão
Registo
23 Jan 2007
Mensagens
10,624
Local
Braga
Agosto 2007

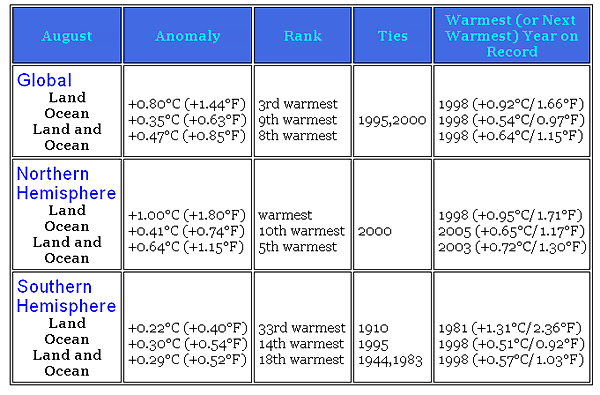
Relatório de Agosto 2007 do NCDC:

http://www.ncdc.noaa.gov/oa/climate/research/2007/aug/aug07.html

Introdução:
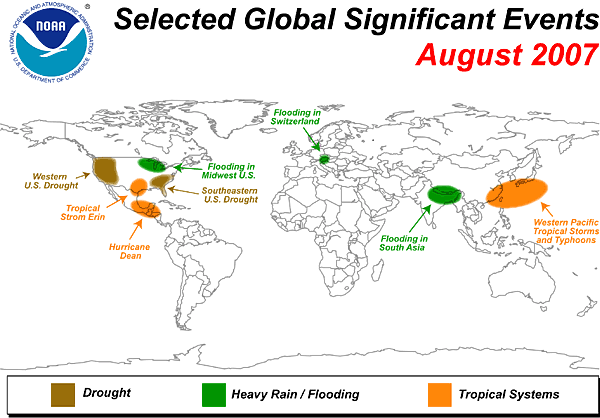
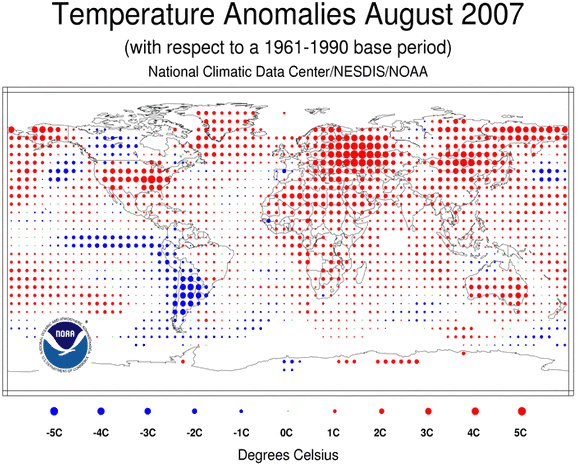
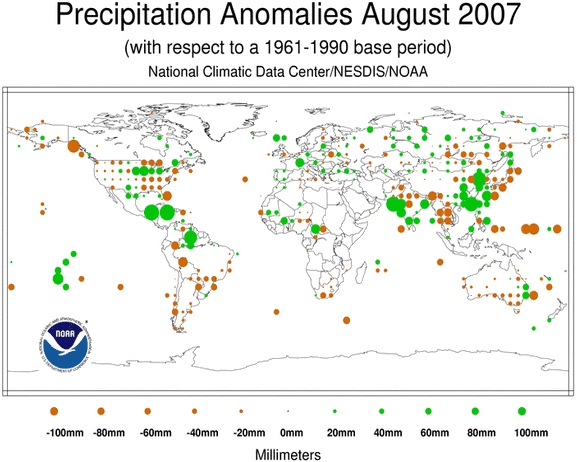
Anomalously warm temperatures have covered much of the globe throughout the year. The January-August 2007 map of temperature anomalies shows the presence of warmer-than-average temperatures across all land areas, with the exception of the southern countries located in South America and the south central states in the contiguous U.S. Warmer-than-average Sea Surface Temperatures (SSTs) occurred in the Atlantic, Indian, and the Northwest Pacific oceans. Cooler-than-average conditions were observed in the Niño 1+2 and 3 regions, the northeastern Pacific and some areas in the southern oceans.

During the boreal summer, there were above average temperatures across northwestern Africa, southern Australia, eastern Brazil, and most of Europe, Asia, and the U.S., including Alaska. Meanwhile, cooler-than-average conditions occurred in northern Australia, the southern parts of South America, and parts of the south central U.S.


Eventos significativos:

sig08.gif


Anomalias

temp08.gif


prec08.gif


Ranking

rank08.gif


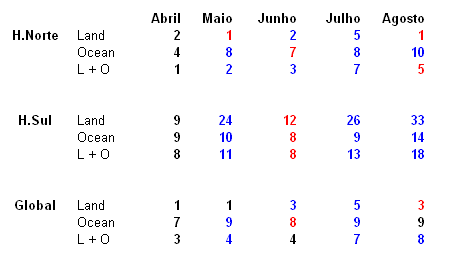
Evolução Mensal do Ranking
A minha tabelinha de evolução. Continuo a achar estranho o peso do H.Sul nisto tudo.

rank08-1.gif
 

Vince

Furacão
Registo
23 Jan 2007
Mensagens
10,624
Local
Braga
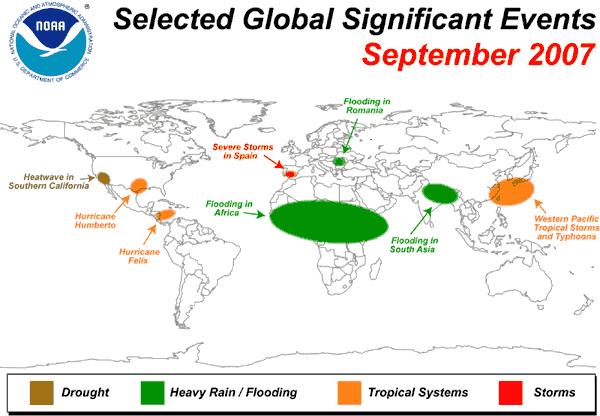
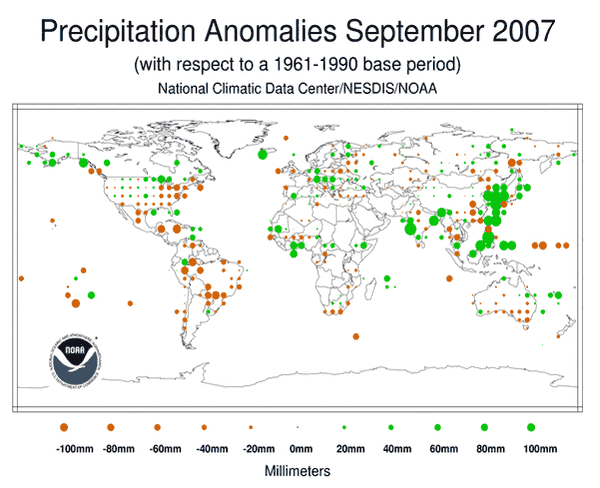
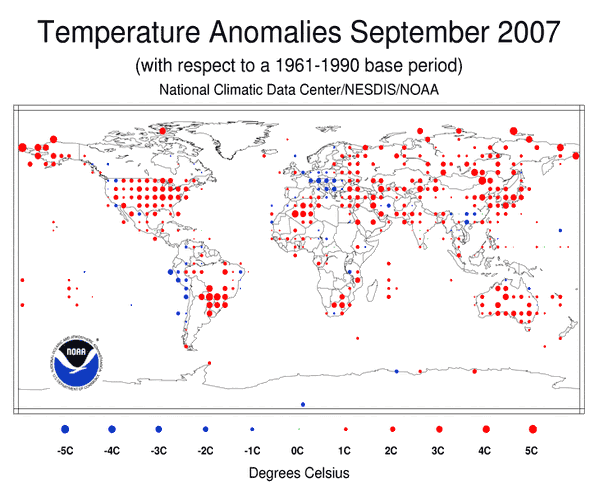
Setembro 2007

Relatório de Setembro 2007 do NCDC:

http://www.ncdc.noaa.gov/oa/climate/research/2007/sep/global.html

Destaques:
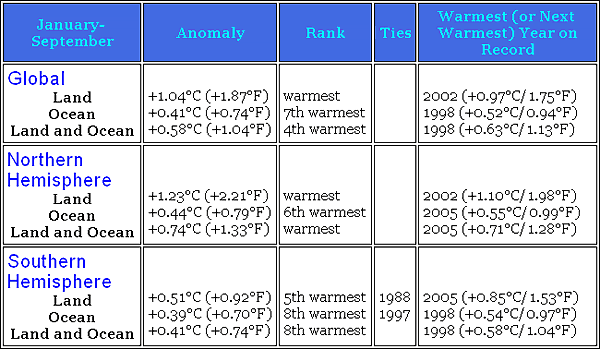
* Based on preliminary data, the globally averaged combined land and sea surface temperature was the fifth warmest on record for September and the fourth warmest on record for January-September year-to-date period.
* September 2007 temperatures were above average in the contiguous U.S., Australia, and most of Alaska and Asia. Cooler-than-average conditions occurred in Peru and central Europe.
* Precipitation during September 2007 was above average in Japan, North and South Korea, the Philippines, and parts of India and Bangladesh. Drier-than-average conditions were observed in the northern and southern eastern region of the contiguous U.S., southeastern Australia, and parts of South America and eastern Asia.
* Cold phase (La Niña) ENSO conditions strengthened during September.


Eventos significativos:

hz.gif


Anomalias

pr.gif


tm.gif


Ranking

ra.gif


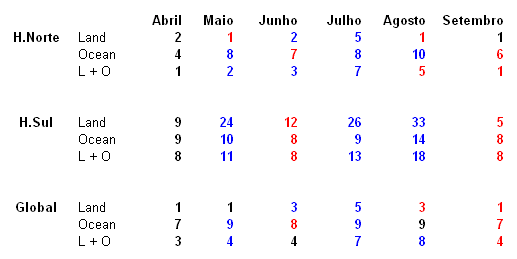
Evolução Mensal do Ranking

rae.gif
 

Vince

Furacão
Registo
23 Jan 2007
Mensagens
10,624
Local
Braga
Outubro 2007

Relatório de Outubro 2007 do NCDC:

http://www.ncdc.noaa.gov/oa/climate/research/2007/oct/oct07.html

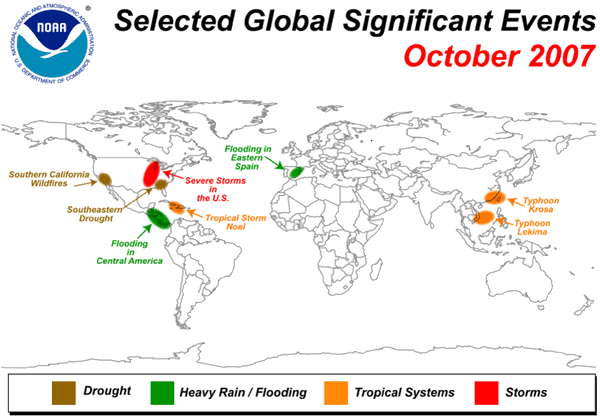
Destaques:

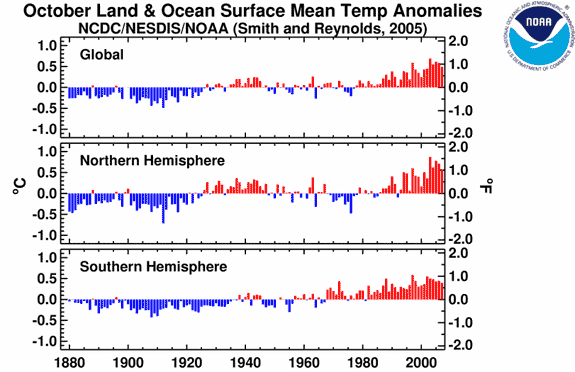
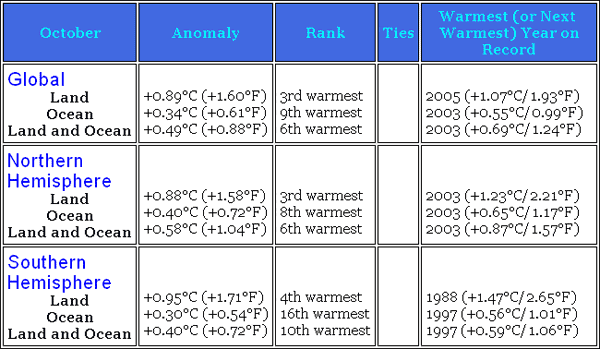
The combined global land and ocean surface temperature for October was the sixth warmest on record, 0.88°F/0.49°C above the 20th century mean. For the January-October year-to-date period, the global land surface temperature was the warmest on record. La Niña ENSO (El Niño-Southern Oscillation) conditions persisted in the equatorial Pacific in October.

In Costa Rica, heavy rain that fell between October 10-11 caused widespread floods that washed away over 800 homes and prompted a deadly mudslide. The mudslide was reported to be the worst weather disaster for Costa Rica in years, claiming more than 10 lives and burying hundreds of homes in the town of Atenas.

Tropical Storm Noel became the deadliest storm of the 2007 season and made landfall in Haiti on October 29, with maximum sustained winds near 50 mph. The storm caused widespread floods, prompted landslides across the island of Hispaniola, and claimed more than 140 lives in the Dominican Republic and Haiti.


Eventos significativos:

eventos.gif


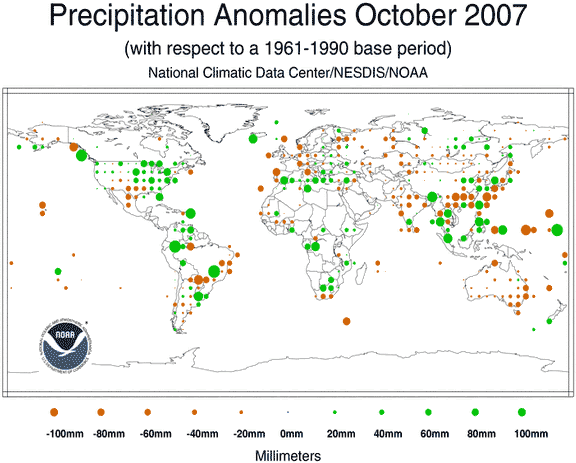
Precipitação

prec-4.gif


Temperatura

temp-1.gif


Ranking

quadro.gif
 

Vince

Furacão
Registo
23 Jan 2007
Mensagens
10,624
Local
Braga
Relatório Anual 2007 (preliminar)
RELATÓRIO ANUAL 2007 (PRELIMINAR)
Relatório preliminar do ano 2007 do NCDC:
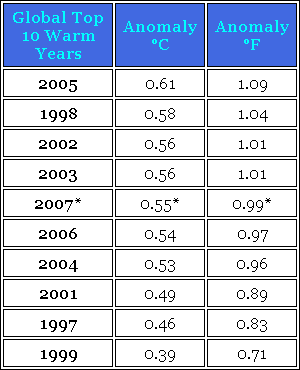
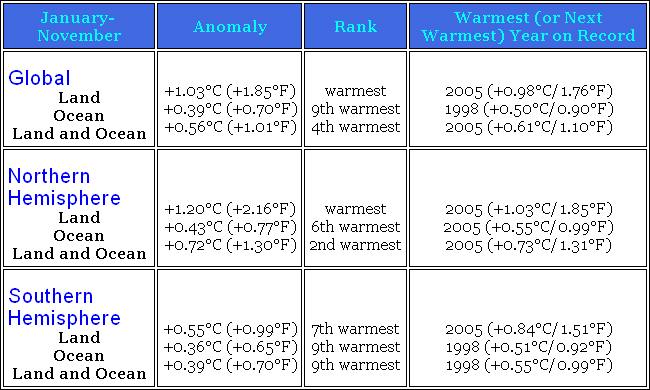
O ano de 2007 é o 5º ano mais quente desde que há registos para já, não contando com os dados de Dezembro.
Não tendo em conta os Oceanos, foi o mais quente de sempre, devido sobretudo às anomalias no Hemisfério norte.

Climate of 2007 - in Historical Perspective Preliminary Annual Report
National Climatic Data Center 13 December 2007
http://www.ncdc.noaa.gov/oa/climate/research/2007/ann/ann07.html

Destaques:
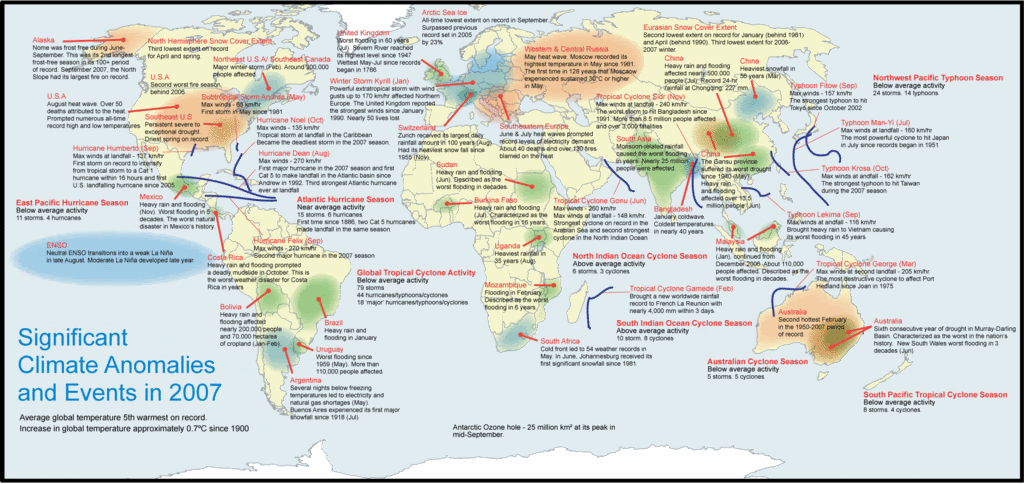
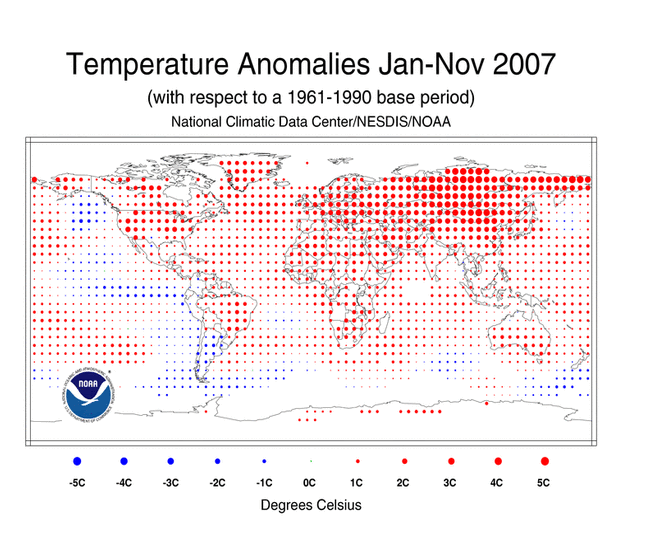
The global annual temperature for combined land and ocean surfaces for 2007 is expected to be near 58.0°F and would be the fifth warmest since records began in 1880. Some of the largest and most widespread warm anomalies occurred from eastern Europe to central Asia.

Including 2007, seven of the eight warmest years on record have occurred since 2001 and the 10 warmest years have all occurred since 1997. The global average surface temperature has risen between 0.6°C and 0.7°C since the start of the twentieth century, and the rate of increase since 1976 has been approximately three times faster than the century-scale trend.

The greatest warming has taken place in high latitude regions of the Northern Hemisphere. Anomalous warmth in 2007 contributed to the lowest Arctic sea ice extent since satellite records began in 1979, surpassing the previous record low set in 2005 by a remarkable 23 percent. According to the National Snow and Ice Data Center, this is part of a continuing trend in end-of-summer Arctic sea ice extent reductions of approximately 10 percent per decade since 1979.


Eventos significativos:

significant-extremes20071.gif


Temperatura

map-blended-mntp-200701-200711-pg1.gif


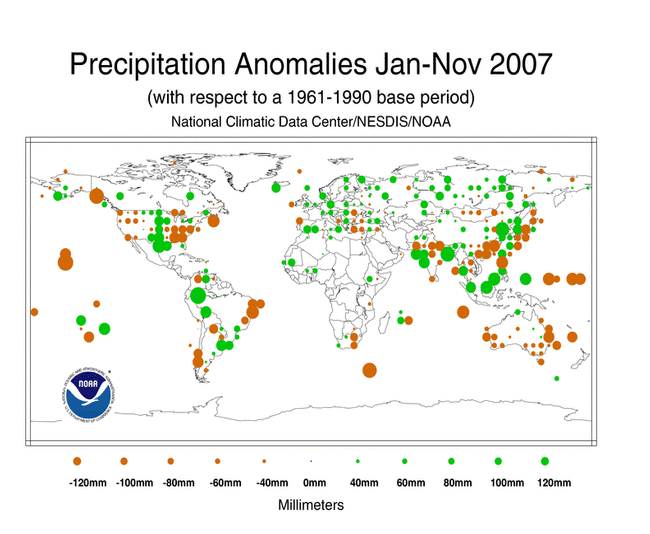
Precipitação

map-prcp-200701-200711-pg1.gif


Ranking

quadro-1.gif


quadro-2.gif


PS:
Aos coolers: Don't shoot the messenger :D
E afinal não parece mau de todo, 2007 foi "apenas" o 5º ano mais quente dos registos. Pode ser que o mês de Dezembro ainda dê para descer mais uma posição no relatório final.