Major eruption of La Soufrière volcano
9-12 April 2021
Region
Caribbean, St Vincent
Satellites
Sentinel-3, Metop B & C, Meteosat-11, GOES-16
Instruments
OLCI, GOME-2, IASI, SEVIRI, VIIRS
Channels/Products
True Colour, Sulfur Dioxide Total Column, Absorbing Aerosol Index, Dust RGB, Ash RGB
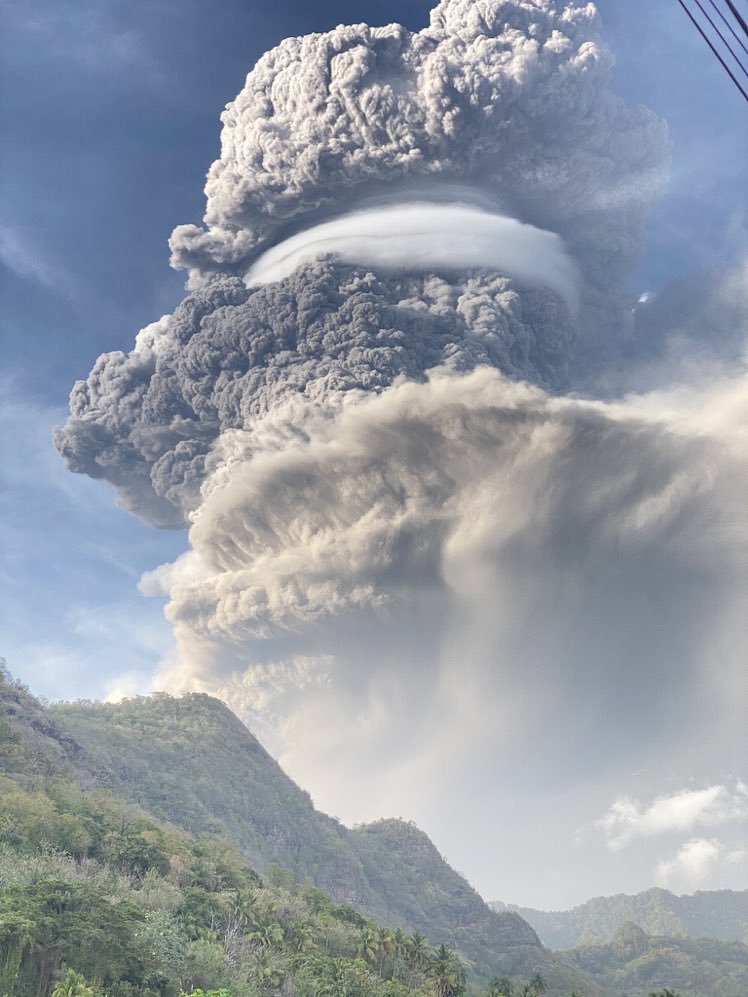
A major eruption of the volcano La Soufrière, on the Caribbean island of Saint Vincent, sent ash over 6 km into the air in early April 2021.
Published on
12 April 2021
By Federico Fierli and Jochen Kerkmann (EUMETSAT)
La Soufrière is an active volcano in Caribbean with a series of major explosive events in the past from the 18th century to 1979. Precursor phenomena in early April warned of an imminent activity and 9 and 11 April there were two explosive eruptions, with intense production of ash which led to evacuations of the local population. This was the largest eruption from the volcano in more than a decade.
Intense volcanic eruptions as the explosive ones of La Soufrière have also an impact on the global environment. In fact, they have a key role in the Earth's climate due to the injection of particles and gases that can modify the radiative budget of the atmosphere. The effect and intensity depends greatly on the total amount of mass and the altitude the eruption reaches. More intense eruptions can inject both ash and, more importantly, gases, as sulfur dioxide and carbon dioxide, up to the stratosphere at around 20 km high, where they can reside for longer periods and be transported around the planet. In 1991 a major eruption from Mount Pinatubo, a stratovolcano in the Philippines, produced a persistent layer of small particles in the stratosphere that had a measurable impact on global temperatures.
It is, therefore, very important to monitor the extent, height and duration for a proper estimate of the impact of eruption at various spatial and temporal scales, using data from different instruments on different satellites.
The images from instruments detecting in the visible range of the spectra identify the presence of ashes. The OLCI instrument on-board the Copernicus Sentinel-3 satellite in Figures 1 shows the phases of the explosive period of the eruption, from 9-11 April. Ash is visible as brown-yellow layers.

Figure 1: Composite of Sentinel-3 OLCI True Colour RGBs, 9-11 April. Source: EUMETView
The image from 11 April which is more focused on St Vincent (Figure 2), is particularly interesting, showing the top-view of the mushroom cloud of the second explosive event (also clearly seen in this
GOES-16 True Color imagery from NOAA).

Figure 2: Sentinel-3 OLCI True Colour, 11 April 13:59 UTC. Source: CODA
Another look at the volcanic plume comes from the aerosol absorbing index (AAI) measured by GOME-2 onboard the Metop satellites. AAI is a degree of the absorption of radiation in the UV and is representative of the amount of particles 'active' in this spectral region (unitless quantity). The Atmospheric Composition Satellite Application Facility (AC SAF) provided a series of maps from the GOME-2 onboard the Metop-B and C satellites in Figure 3, showing the progressive westward extent of the plume.

Figure 3: GOME-2 Absorbing Aerosol Index from Metop C and C from 9-12 April.
The last data used to create a full picture, comes from the detection of sulfur dioxide (SO2) that is emitted by volcanic eruptions. SO2 is particularly important for climate since it can reach the stratosphere, where can interact with water vapour and form small droplets of sulfuric acid that absorb and reflect solar light, which, in turn, reduced incoming radiation, producing surface cooling.
La Soufrière emitted a substantial amount of SO2 up to the tropopause level, as shown by IASI instrument in Figure 4. The SO2 plume was likely transported by upper tropospheric/lower stratospheric easterly winds. The IASI instrument can also estimate the average height of the plume. Data on 10 April shows that SO2 reached 15-17 km high, across the tropopause region, with a raw estimate of a total burden in the order of 0.5 to 1 MTons of SO2 based on the preliminary analysis of Lieven Clarisse, Universitäts- und Landesbibliothek Bonn (ULB).

Figure 4: SO2 total column (top) and plume height (bottom) from Metop-B IASI, 10 April. Credit: Lieven Clarisse, ULB
As well as the data above, Meteosat-11 Ash imagery could be used to spot the plume (Figure 5). The ash/SO2 plume is seen in three colours: red = ash, yellow = ash+SO2, green = SO2. The scene was quite complex as there were many low, mid- and high level clouds. Despite this complication, the massive triangular volcanic plume from La Soufrière is well visible in the imagery, especially in a fast animation.
Figure 5: Meteosat-11 Ash RGB, 9 April 18:00 UTC-10 April 17:00 UTC
The first eruption at around 12:00-13:00 and the more pronounced and widespread second eruption at about 19:00 UTC could also be seen in GOES-16 True Colour imagery (Figure 6).
Figure 6: GOES-16 True Color RGB, 9 April 19:00-21:30 UTC. Credit: NOAA
On 11 April the plume was detected on both GOES-16 Ash products and Dust RGB (Figure 7 and 8).
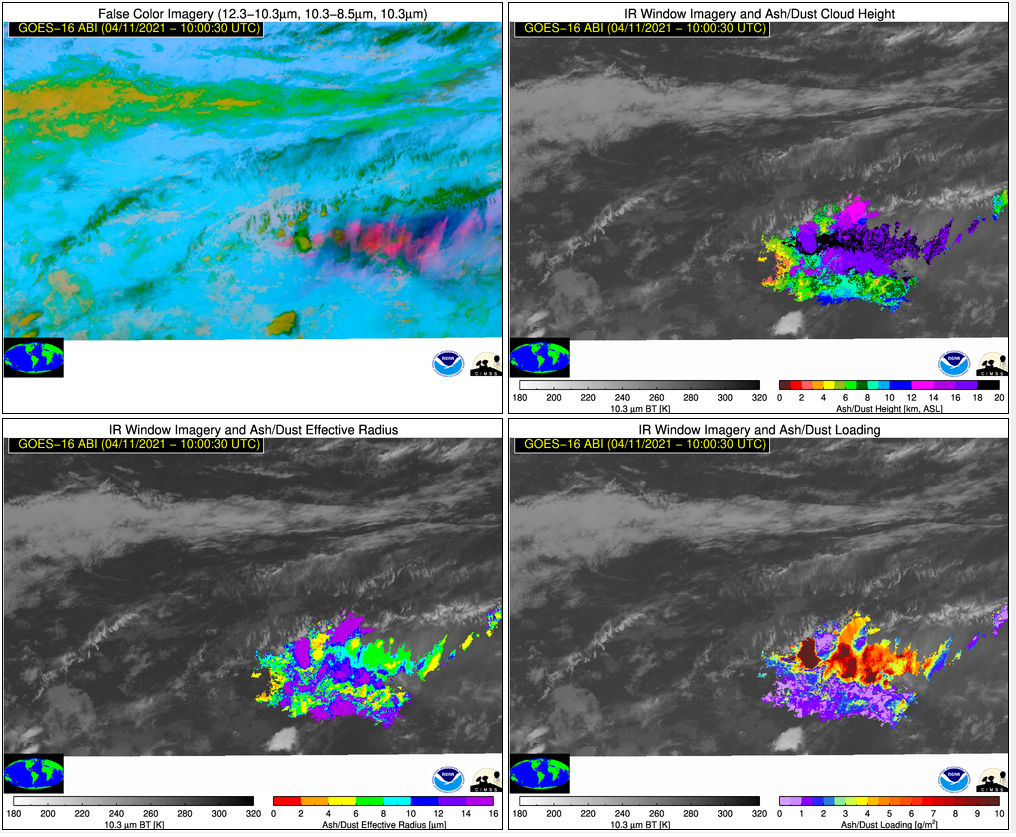
Figure 7: GOES-16 Ash products, 11 April 10:00 UTC. Credit: NOAA
Figure 8: GOES-16 Dust RGB, 11 April 04:20-10:10 UTC. Credit: NOAA
Fonte:
https://www.eumetsat.int/major-eruption-la-soufriere-volcano